
6.1 Energy & Climate
Energy and greenhouse gas emissions are the key drivers of our environmental footprint. Since reopening in 2008, we have pursued a clear goal: to consistently reduce energy consumption and greenhouse gas emissions – without compromising on quality and hospitality. Today, over four-fifths of our energy comes from renewable sources.
Unless otherwise stated, all environmental indicators in this chapter – including energy, greenhouse gas emissions, water and waste – refer to The Dolder Grand (Kurhausstrasse 65, Zurich).
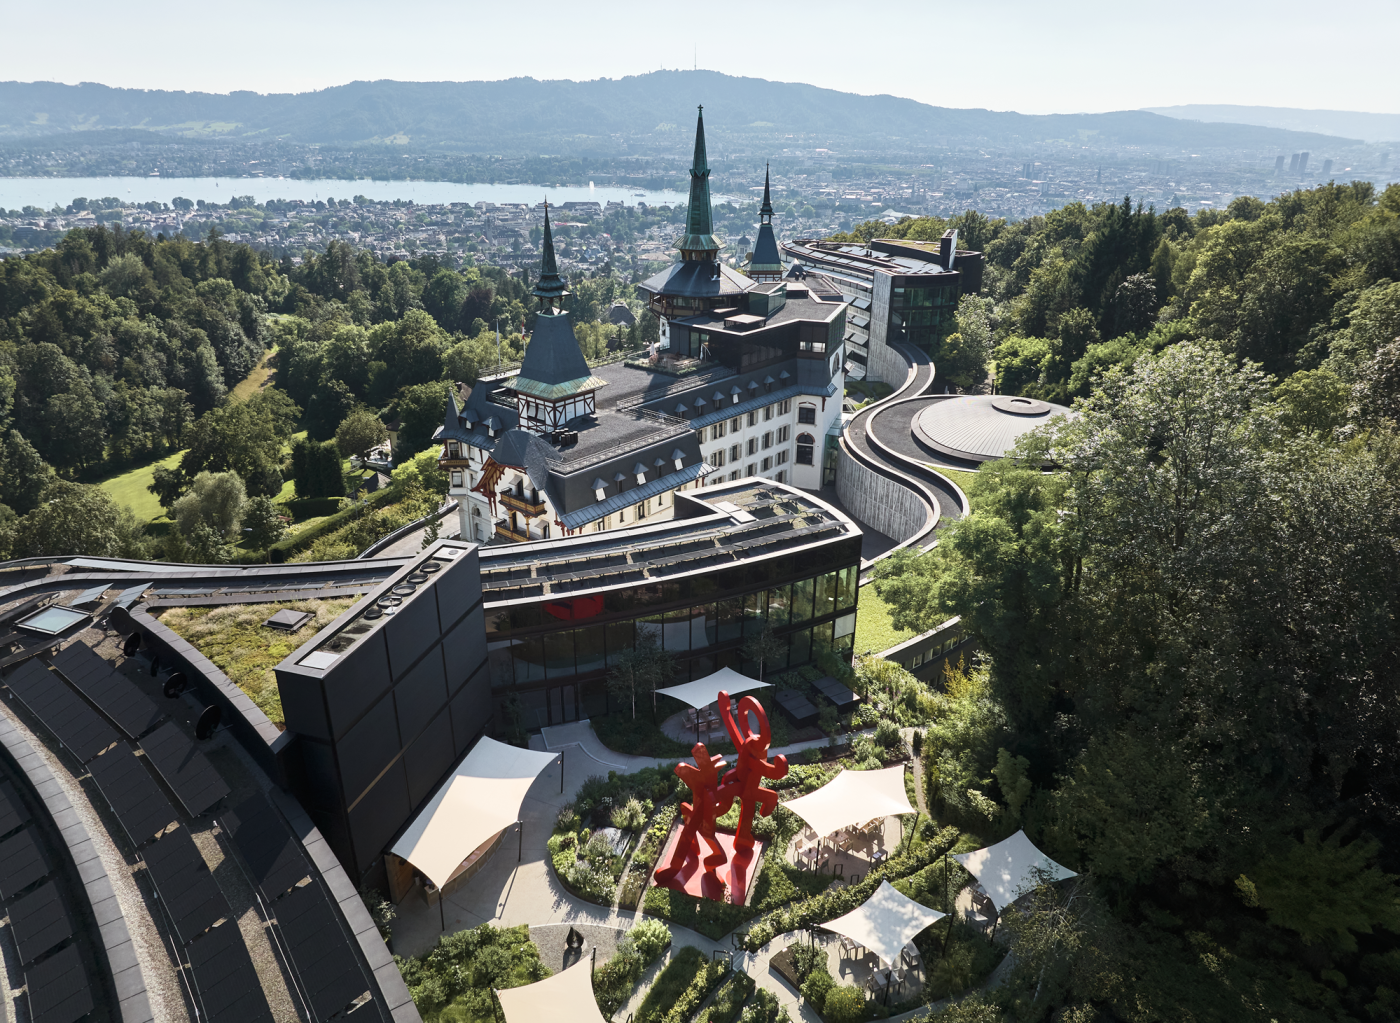
Our energy supply is underpinned by a combination of renewable sources and energy-efficient building technology, which we have been systematically developing since 2008.
We meet just under two-thirds of our energy needs with electricity generated from European hydropower – and, since our reopening in 2008, 100% of this has come from renewable sources. Despite steadily rising visitor numbers, our electricity consumption has fallen by around 10% compared with the year we reopened in 2008. Since 2024, a photovoltaic system comprising 488 panels on the roofs of our modern wing and the Dolderbahn mountain station has supplemented our energy mix. The roof surfaces are covered with an extensive wildflower and sedum green roof, whose evaporative cooling further increases the panels’ efficiency.
Around one-sixth of the energy is supplied by our geothermal system: 70 geothermal probes at a depth of 152 metres provide the Dolder Grand with heating and cooling. In combination with a heat pump, the domestic hot water is preheated from around 8 °C to 45 °C. Supporting energy from the gas boiler is used only to achieve the required high temperature of 65 °C. This ground storage technology has made it possible to halve the building’s overall energy consumption despite the floor area doubling as a result of the 2004–2008 renovation.
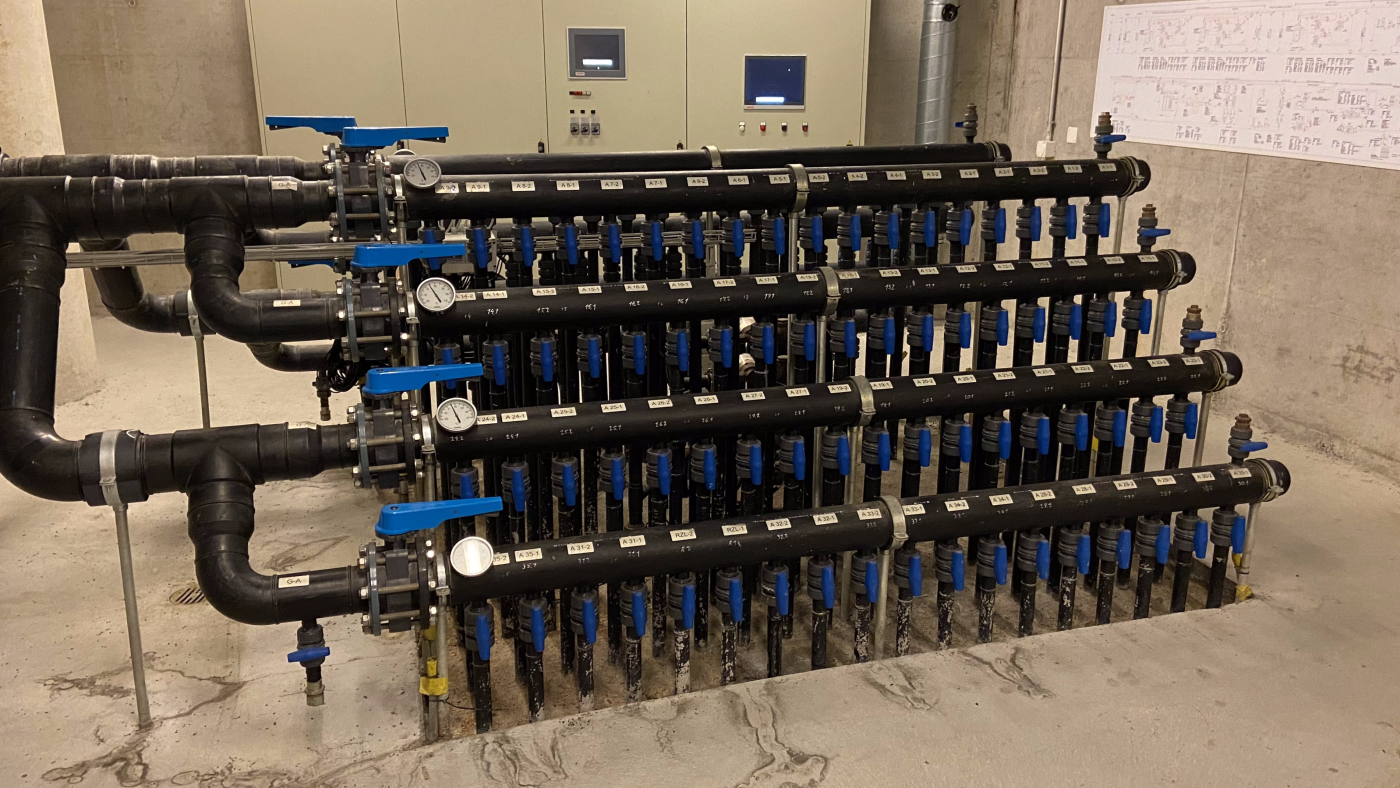
Natural gas is used primarily for peak-load heat generation and to provide high temperatures. Consumption has fallen by around 36% compared to 2008 but remains by far the largest direct driver of emissions. The mix is supplemented by small quantities of bioethanol, wood and charcoal for the catering facilities, as well as propane and butane for the kitchens.
At the Dolder Grand, a modern building management system ensures that energy is used exactly where it is needed. Energy consumption is continuously optimised through the intelligent coordination of systems, operating times and indoor climate. The ventilation systems feature heat recovery: the energy contained in the exhaust air is used to preheat or pre-cool the supply air. This commitment has been recognised with the efficiency label from the Energy Agency for Industry (EnAW), of which Dolder Hotel AG has been a member since 2005 as part of a measure-oriented target agreement.
We also focus on resource-saving initiatives when it comes to the guest experience: our Linen & Towel Policy stipulates that bed linen is changed only every three days as standard, and towels only on request. This policy reduces washing cycles, energy consumption, water usage and the use of detergents. In addition, guests can actively opt out of the daily room cleaning service.
When it comes to our vehicle fleet, we are increasingly transitioning to electric and hybrid powertrains: four of our six limousines are already hybrid or electric vehicles. Our guest vehicles (complimentary cars) comprise one fully electric vehicle in summer, and one electric and one hybrid vehicle in winter. To help guests travel with lower emissions, we provide a charging infrastructure in the car park with load management, as well as additional charging points at the Main Building.
Through the myclimate programme Cause We Care (since 2020), guests can make a voluntary climate contribution; the hotel matches the amount and invests half of the guest’s contribution in the climate protection project ‘Back to the Green Island in Madagascar with energy-efficient cookers’, and the remainder in local energy efficiency and greenhouse gas reduction measures. Since 2020, the contributions to the project in Madagascar have reduced around 11,400 tonnes of CO₂e, supplemented by a further 3,400 tonnes from additional climate protection investments.
Our seminar packages are vegetarian as standard. Meat or fish options can be booked for an additional charge, of which CHF 2.00 per person is donated to Cause We Care as a climate contribution. In the staff restaurant Green, the menu is fully vegan every Wednesday – an initiative (Vegan Wednesday, since 2021) that originated from staff suggestions and was implemented by the D-Impact team.
The Dolder Grand’s total energy consumption in the 2025 reporting year amounted to approximately 10,700 MWh, with renewable energy accounting for 83.5% of this total.
| Energy sources | Renewable | Non- renewable | Total (MWh) |
|---|---|---|---|
| Electricity (purchased, hydroelectric) | 6,812 | 6,812 | |
| Own generation from photovoltaics | 230 | 230 | |
| Geothermal energy (ground-source heat pumps) | 1,861 | 1,861 | |
| Stationary fuels | 29 | 1,666 | 1,695 |
| – of which natural gas | 1,663 | ||
| – of which propane / butane | 2 | ||
| – of which bioethanol, wood, charcoal | 29 | ||
| Transport fuels (petrol, diesel) | 102 | 102 | |
| Total | 8,932 | 1,768 | 10,700 |
| Share | 83.5% | 16.5% | 100% |
Source: EarthCheck benchmark data 2025 / internal consumption data. Figures rounded. Electricity as per utility bill; geothermal energy includes heating and cooling generated by the geothermal well field; photovoltaics = on-site self-generation.
Since 2008, we have been systematically recording and analysing our greenhouse gas emissions to document progress and derive targeted reduction measures. Since 2021, accounting has been carried out in partnership with myclimate and covers not only energy-related emissions but also other operational activities along the value chain.
Accounting is carried out in accordance with the internationally recognised greenhouse gas accounting standard – the GHG Protocol (Greenhouse Gas Protocol, WRI, 2004) – and covers all emissions under the company’s operational control.
In the 2025 reporting year, Dolder Hotel AG’s total emissions amounted to 4,047.51 tonnes of CO₂e.
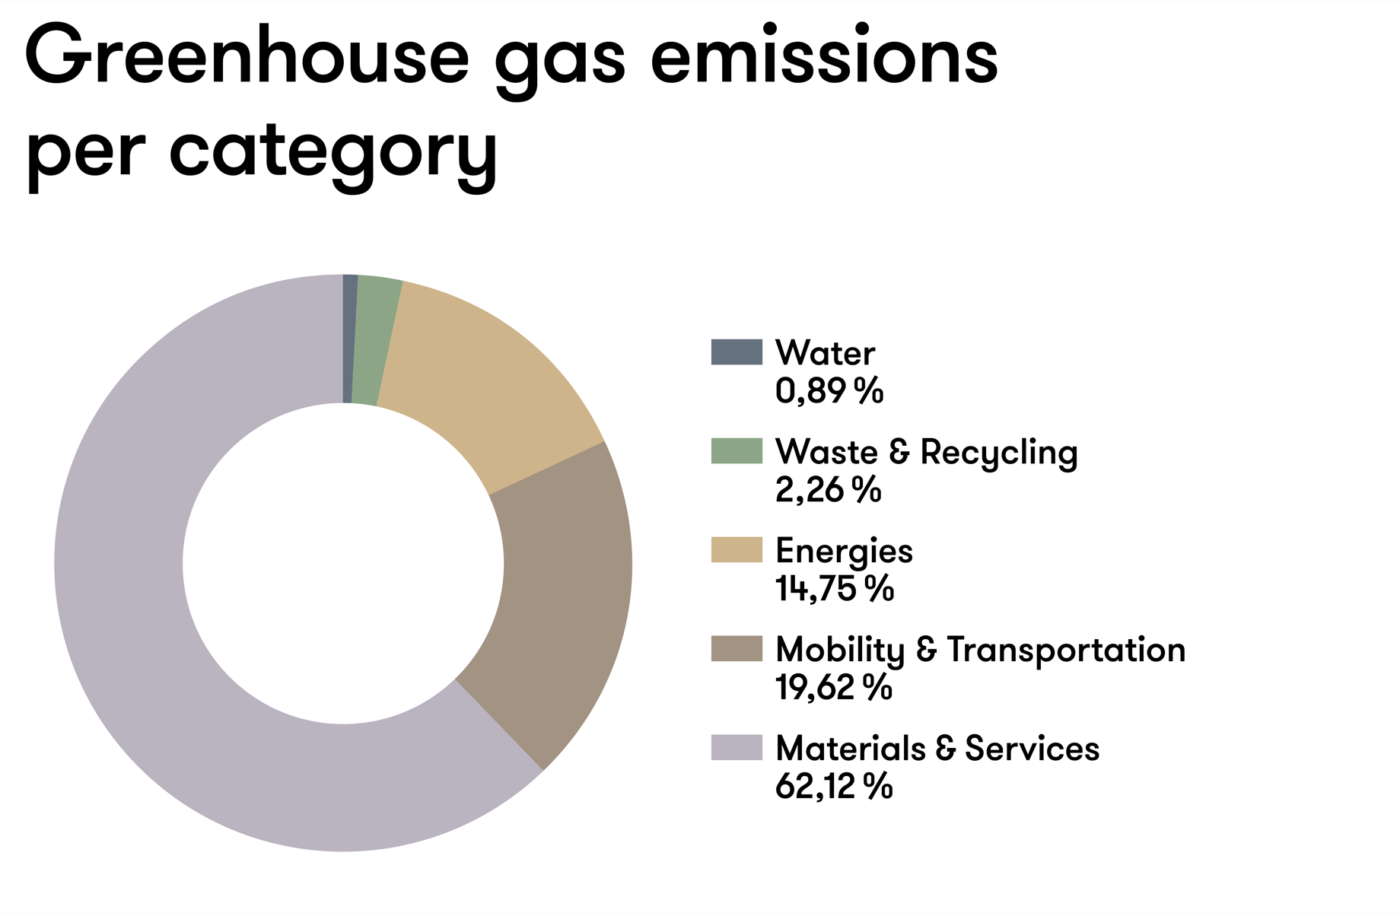
Greenhouse gas emissions by scopes
Emissions are categorised into three scopes in accordance with the GHG Protocol:
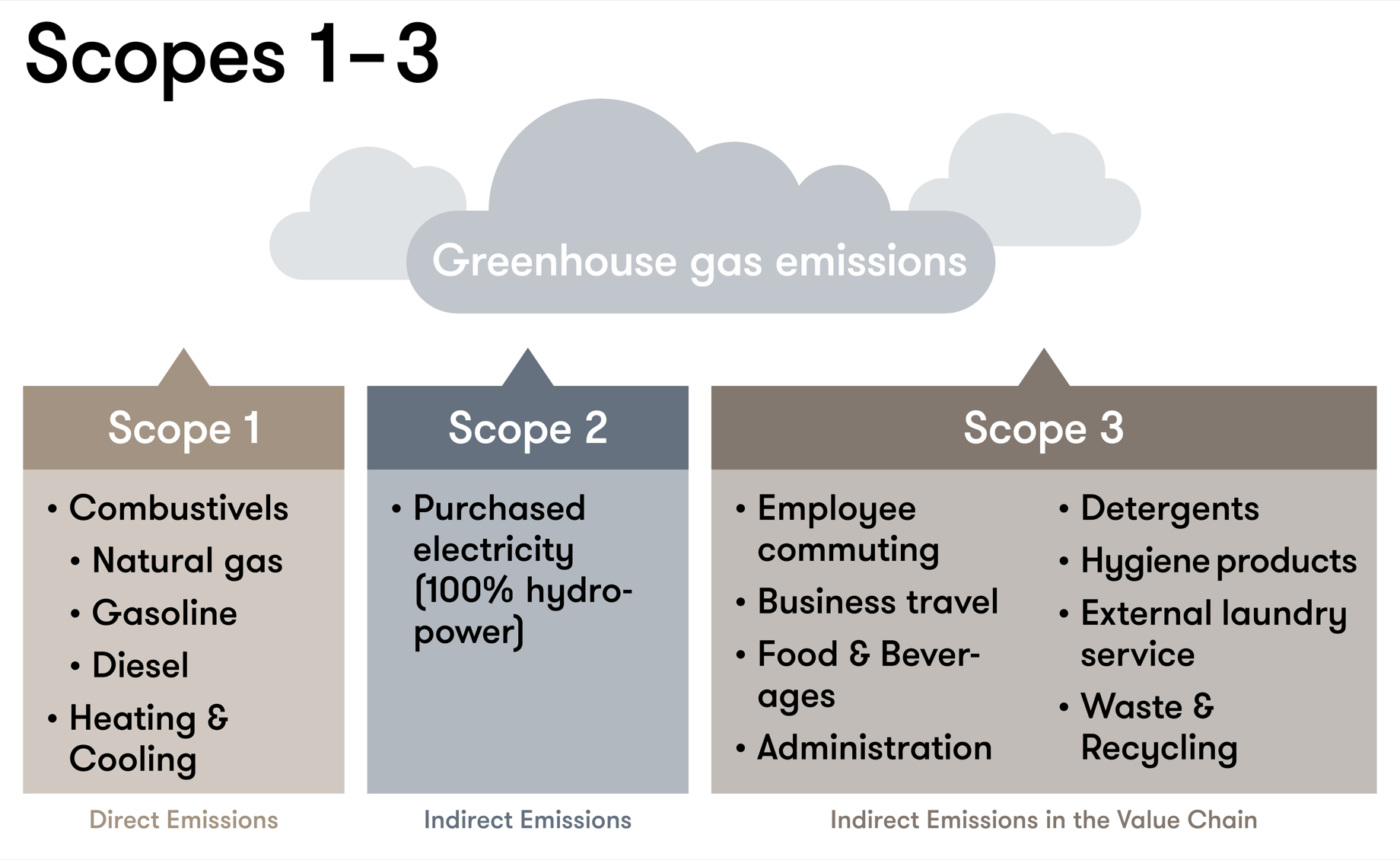
Scope 1 (direct emissions from the company’s own operational facilities and own vehicles): 383 t CO₂e (9.5%) – mainly from natural gas used for heat generation and the vehicle fleet.
Scope 2 (indirect emissions from purchased energy: electricity, steam, heating and cooling for own use): 1.4 t CO₂e (< 0.1%) – virtually zero due to the procurement of 100% renewable electricity (market-based).
Scope 3 (indirect emissions in the value chain): 3,663 t CO₂e (90.5%) – by far the largest share. The accounting covers all key categories of the GHG Protocol, including the procurement of goods and services, upstream energy generation, employees’ commutes, external laundry services, business travel, transport and distribution, capital goods and operational waste. The largest single item is catering: food and beverages alone account for 56% of total emissions, at 2,258 t CO₂e. Other significant contributors are employee commuting (474 t CO₂e, 12%), upstream heating and cooling (479 t CO₂e, 12%), external laundry services (243 t CO₂e, 6%), business travel (162 t CO₂e, 4%) and waste and recycling (47 t CO₂e, 1%).
Year-on-year comparison 2023, 2024, 2025
B3, §30 – incl. voluntary Scope 3 disclosure in accordance with the comprehensive module (§50–53)
| Emissions source | 2023 in t CO₂e | 2024 in t CO₂e | 2025 in t CO₂e |
|---|---|---|---|
| Total Scope 1 | 350.98 | 352.87 | 383.28 |
| Scope 2 (site-based) | 117.86 | 115.38 | 116.11 |
| Scope 1 + 2 (site-based) | 468.84 | 468.25 | 499.39 |
| Scope 2 (market-based, 100% renewable electricity) | 1.44 | 1.40 | 1.41 |
| Scope 1 + 2 (market-based) | 352.42 | 354.27 | 384.69 |
| Total Scope 3 | 3,551.64 | 3,436.05 | 3,662.82 |
| Total Scope 1+2+3 emissions (market-based) | 3,904.06 | 3,790.32 | 4,047.51 |
Source: myclimate GHG accounting. Scope 2 site-based: calculated based on the Swiss electricity mix (emission factor approx. 0.0169 kg CO₂e/kWh according to BAFU/KBOB). Scope 2 market-based: 100% of electricity is sourced from certified Swiss hydropower (guarantees of origin). The market-based figure is provided in addition in accordance with the GHG Protocol Scope 2 Guidance.
| Indicator | 2024 | 2025 |
|---|---|---|
| Scope 1+2 (site-based) / Revenue | 7.1 t CO₂e / CHF million | 6.6 t CO₂e / CHF million |
| Scope 1+2 (market-based) / Revenue | 5.4 t CO₂e / CHF million | 5.1 t CO₂e / CHF million |
| CO₂e Scope 1+2 / guest | 3.36 kg | 3.06 kg |
| CO₂e Scope 3 / guest | 28.56 kg | 29.15 kg |
Source of emissions: myclimate accounting in accordance with the GHG Protocol. Intensity metrics: reference value EarthCheck activity level (guest nights).
The ‘per guest’ GHG intensity metrics are based on the EarthCheck activity level (2025: 125,656 guest nights). This is calculated as follows:
Overnight guests + staff overnight stays + (day visitors ÷ 3) + (external restaurant guests ÷ 4)
Day visitors include event guests, day spa guests and spa member visits. The weighting factors (÷ 3 and ÷ 4) reflect the lower resource consumption of day visitors compared to overnight guests.
The 71,442 guest nights referenced in the ‘About this report’ section refer exclusively to overnight stays. The EarthCheck activity level is used consistently for all environmental indicators (energy, water, waste, emissions per guest) and enables comparison with EarthCheck benchmarking.
Our environmental strategy in the areas of energy and climate pursues the following objective: the gradual decarbonisation of operations whilst simultaneously increasing energy efficiency. The measurable targets are set out in our sustainability scorecard and are reviewed annually.
| Target | Base year | Baseline | Target 2026 |
|---|---|---|---|
| Total CO₂e (t) (rounded) | 2025 | 4,048.00 | 3,643.00 |
| CO₂e Scope 1+2 / guest (kg) | 2025 | 3.06 | 2.76 |
| CO₂e Scope 3 / guest (kg) | 2025 | 29.15 | 26.23 |
| Renewable energy (%) | 2025 | 83.5% | 85.0% |
| Total electricity consumption per guest (MJ) | 2025 | 318.68 | 286.81 |
| Stationary fuels / guest (MJ) | 2025 | 50.46 | 45.41 |
Scope coverage: 100% of Scope 1 and Scope 2 emissions, as well as the material Scope 3 categories.
The following initiatives are being implemented or are planned to achieve the set targets:
Decarbonisation of the heat supply. Natural gas is by far the largest direct driver of emissions and accounts for the vast majority of our Scope 1 and 2 emissions. The efficiency and optimisation measures currently being implemented are leading to a moderate reduction in CO₂ emissions in the low single-digit percentage range. As the majority of emissions are attributable to the use of natural gas, the overall effect remains limited. A significant reduction also requires structural adjustments to heat generation. In the short to medium term, the focus is on reducing consumption through operational efficiency improvements and plant optimisation. At the same time, we are evaluating options for structural adjustments to heat generation with a view to replacing fossil fuels in the long term.
In the short term, additional measures such as the planned heat recovery from the grease traps of our kitchens will contribute to further efficiency gains.
Building services and operations management. Energy flows are systematically analysed via the central building management system to continuously identify and realise efficiency potential. Specifically, this includes the ongoing upgrade of room controls with energy-saving mode, the hydraulic balancing of the heating system, the continued conversion to LED lighting – which was extended to further building areas during the reporting year – as well as the optimisation of ventilation and hot water production.
Electrification of the vehicle fleet. In the 2025 reporting year, the guest fleet was converted from BMW 7 Series diesel models to BMW 7 Series hybrid vehicles. This enabled a further reduction in direct CO₂ emissions from guest transport and business travel. The gradual electrification will continue, with the aim of further reducing the remaining fossil fuel share in saloons and company vehicles.
Scope 3 reduction. The greatest reduction potential lies in catering and beverages (56% of total emissions) and staff commuting (12%). A separate mobility survey (2025) highlights where this potential lies: although 55% of the workforce uses public transport, 66% of commuting emissions are attributable to the 38% who drive to work. The average commuting distance per full-time equivalent is 38.3 km, which is above the Swiss average of 27.4 km. On this basis, incentives for sustainable mobility are currently being reviewed.
Emissions credits and climate protection investments
Emissions credits are not counted as a reduction in gross emissions but are reported separately (see VSME §218/§219).
| Cumulative total since 2020 | of which 2025 | |
|---|---|---|
| Cause We Care | ||
| Climate protection contribution (CHF) | 325,211 | 38,689 |
| Climate protection contribution reduction (t CO₂e) | 11,371 | 1,353 |
| Further climate protection investments | ||
| Offsetting of business flights (CHF) | 21,986 | 4,657 |
| Offsetting of business flights (t CO₂e) | 773 | 163 |
| Additional climate protection contributions (2022, 2023, 2024) (CHF) | 75,299 | |
| Additional climate protection contributions (2022, 2023, 2024) (t CO₂e) | 2,633 | |
| Total | ||
| Investment (CHF) | 423,229 | 43,346 |
| Emissions reduction (t CO₂e) | 14,800 | 1,516 |
The credits originate from myclimate climate protection projects, in particular the project ‘Back to the green island in Madagascar with energy-efficient cookers’ (emissions reduction). Dolder Hotel AG does not use the term ‘climate-neutral’.
In the 2025 reporting year, Dolder Hotel AG had not yet carried out a systematic analysis of physical and transitional climate risks, including the assessment of climate-related hazards and transition events as well as their potential impacts on assets, business operations and the value chain.